This lesson is translated by our partner in Salamanca, you can find resources in Spanish here | Ideas y recursos en Español
1.Overview
This lesson is provided to help the understanding of some basic concepts of programming visual elements and to help in developing spatial and geometric thinking.
Brief description:
In this lesson related to understanding the concepts related to programming visual elements students will understand how to create a canvas, fill a background with a specific colour and put some geometric figures inside it, through successive small exercises that introduce learners in the foundations of programming visualisations using different basic syntax and programming control functions.
Age recommended:
10-14 years old
Level:
Intermediate/Advanced
21st Century skills:
- Mathematical Thinking
- Computational Thinking
- Spatial thinking
2.Aim of the lesson
This lesson is intended to develop in young people skills related to mathematical thinking, computational thinking and spatial thinking (mostly). In it, the young people work with the basics of visual representation of geometric figures through programming them. This can help learners to develop spatial thinking, understanding how the objects can be shown in a canvas (a dimension) and how they can be moved within. Moreover the location of digital objects, this activity can be used to teach students about color composition, colour experimentation, colour proper use, etc. by complementing the basic aspects with some extra activities using colour filling and composition.
3.Tool
P5.js (Processing in Javascript). A web environment is available in http://p5ide.herokuapp.com/
The full reference for P5.js https://p5js.org/reference/
A tool to help students to choose colors is available in http://www.w3schools.com/colors/colors_picker.asp
4.Practical activity
The practical activity is divided in several exercises, from most simple to most complicated. Following are presented the different exercises:
1. Create a canvas, colorize it
First of all, and after explaining the two mandatory blocks/functions in Processing (setup() and draw()), the learner will create a canvas, like the following:
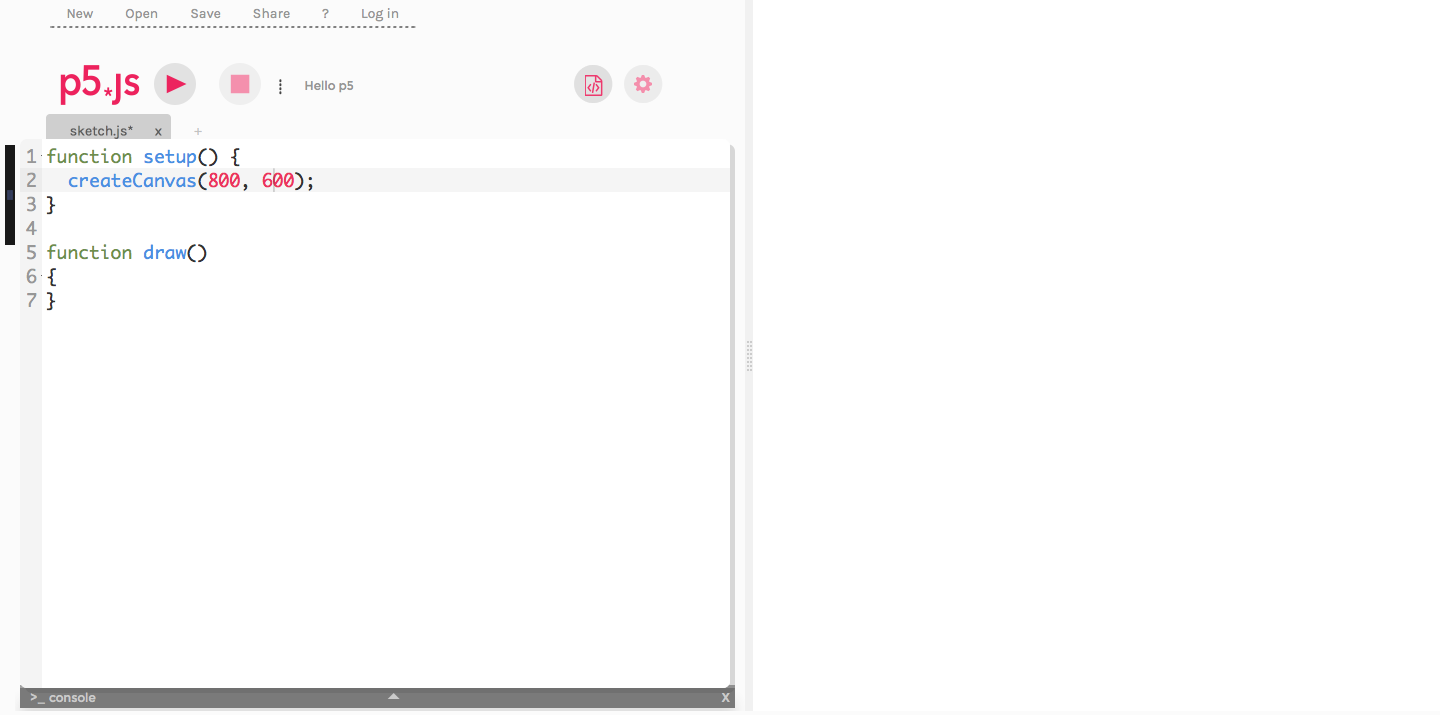
Figure 1: Creation of an invisible canvas (canvas created, not filled in color)
After that, teacher will explain the need of colorizing the canvas in order to see it. At this point, the teacher can explain the color RGB system (or another similar if its needed); as well, the teacher can explain the grey scale. Examples:
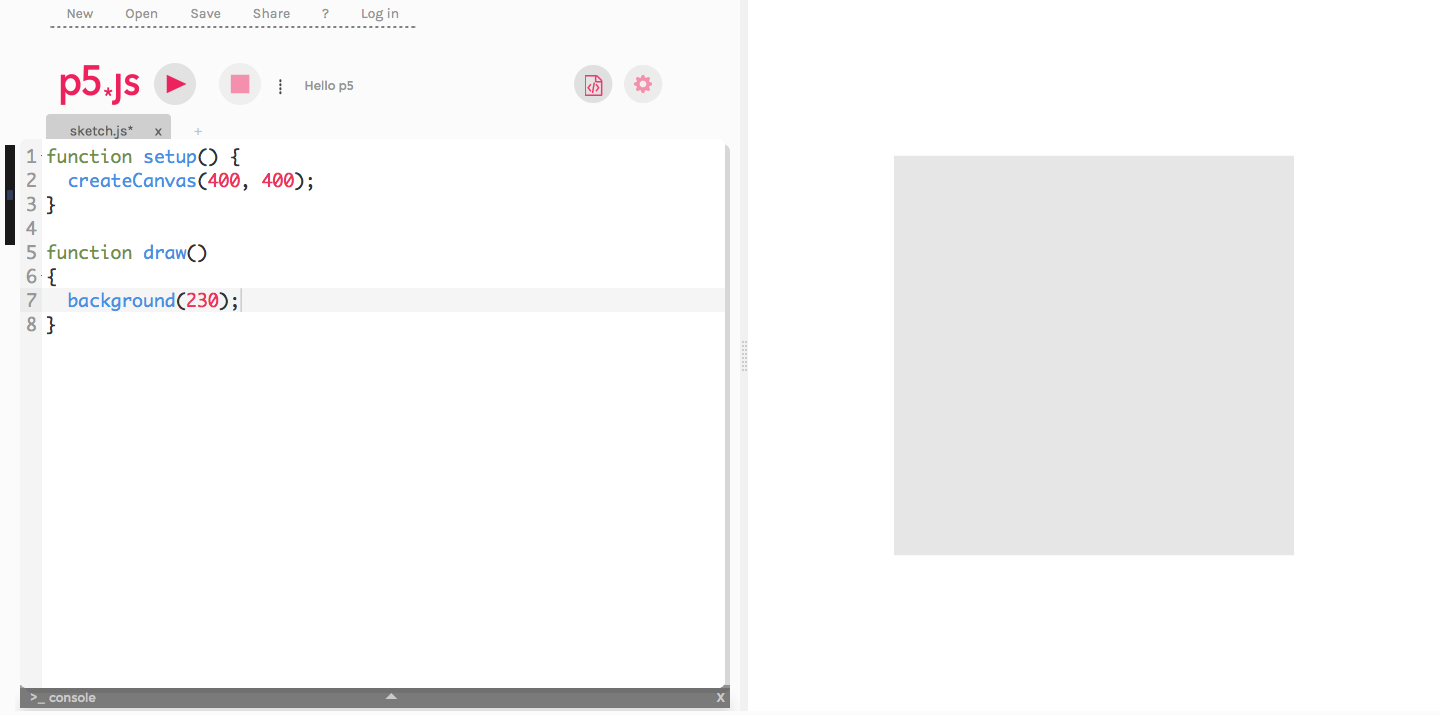
Figure 2. Canvas created and filled in grey scale (light grey)
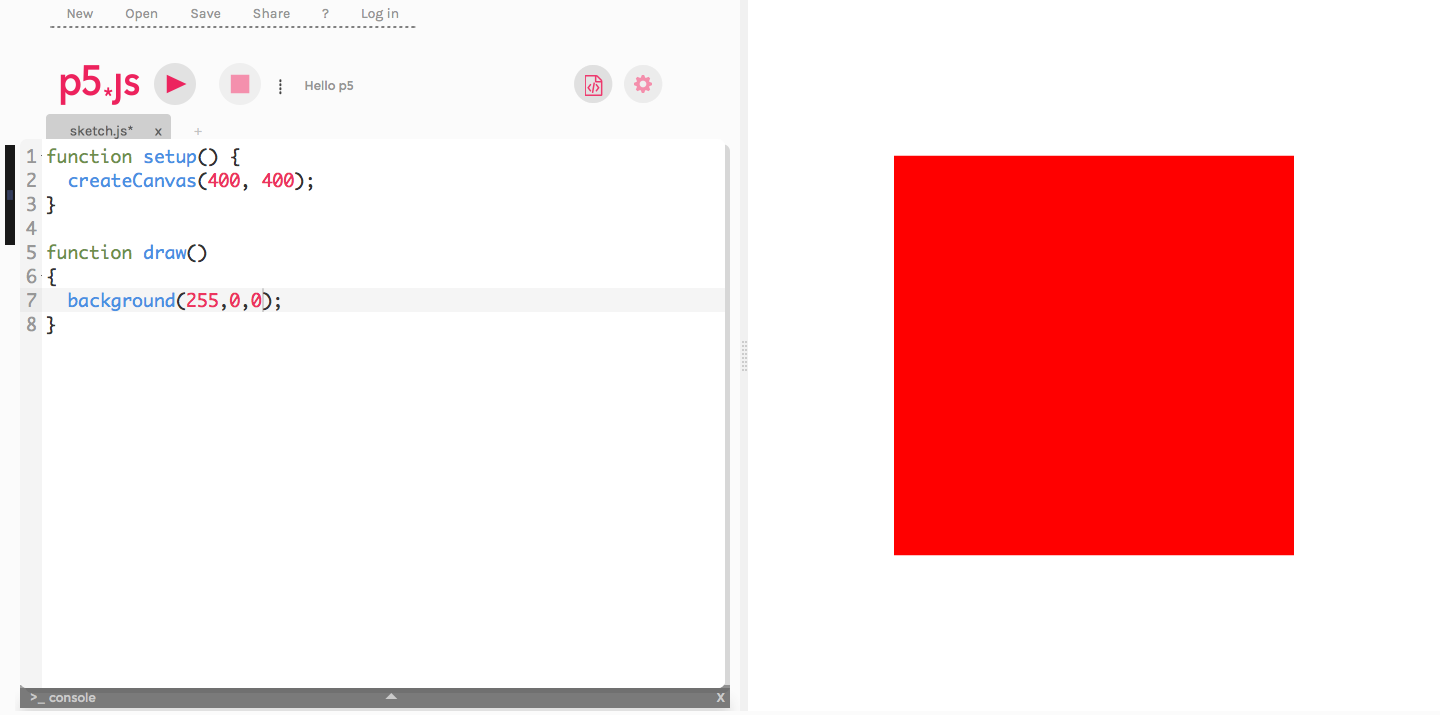
Figure 3. Canvas created and filled in red color
2. Painting geometric figures in the canvas
After that, teacher can explain some different basic geometric figures in processing, like point, line, ellipse or rectangle. This explanation should cover the different properties and features for each geometric figure (size, position, etc.). The learner will experiment the usage of each of them through painting them inside the canvas:
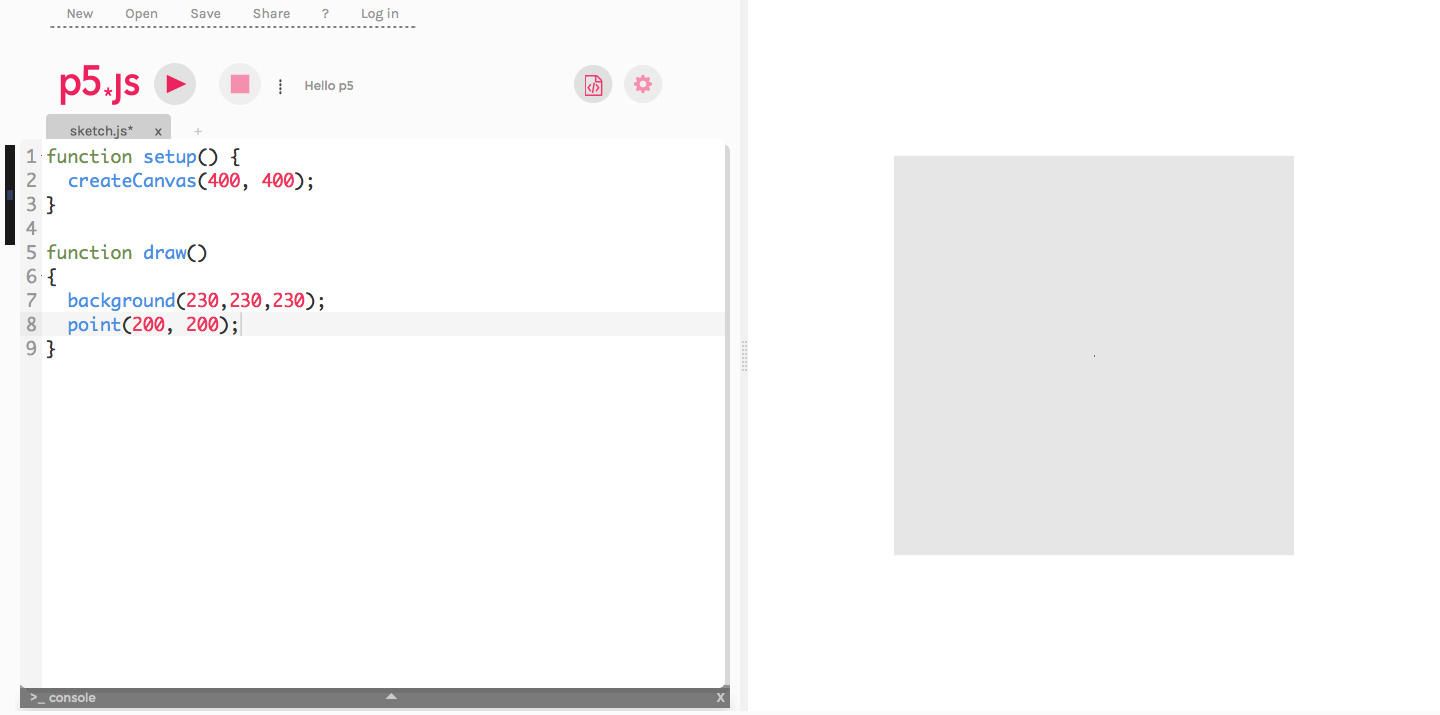
Figure 4. Putting a sole point in the center of the created canvas
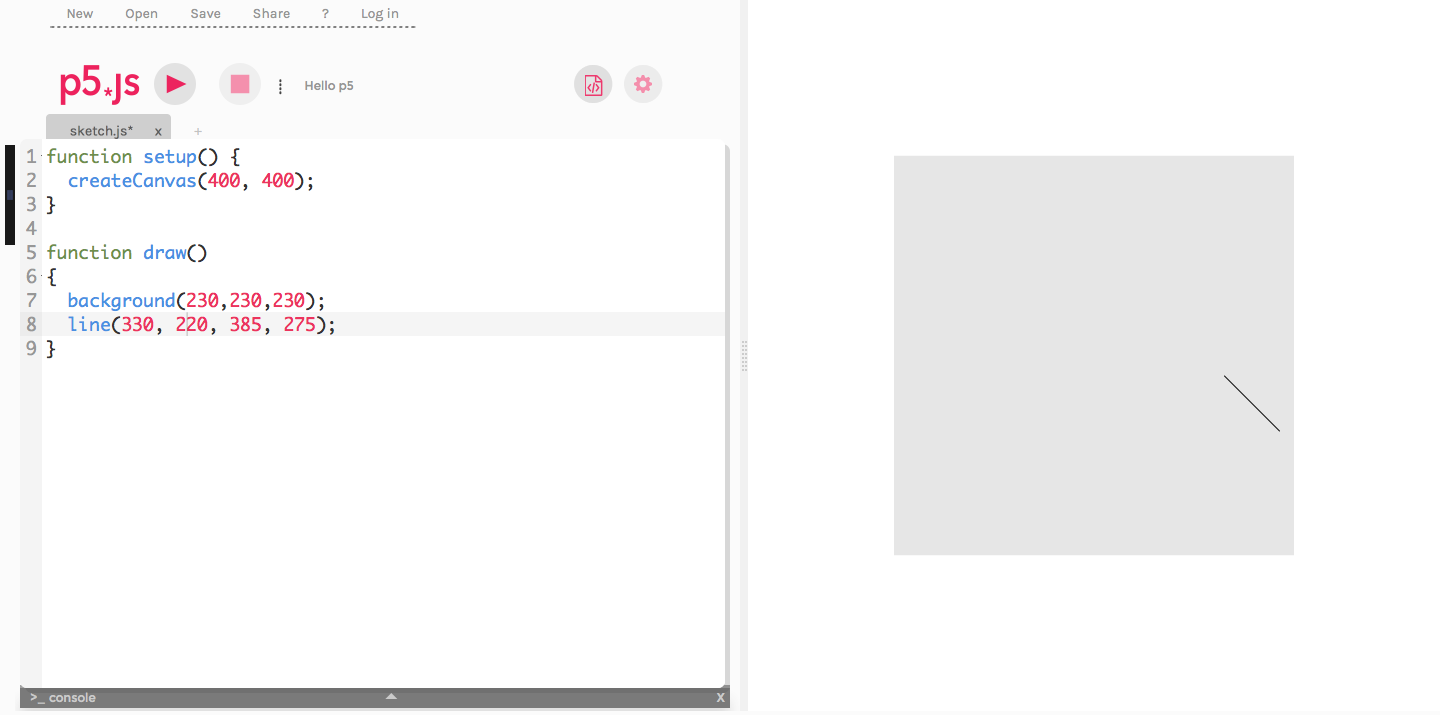
Figure 5. Painting a line near to the right-bottom corner at the canvas
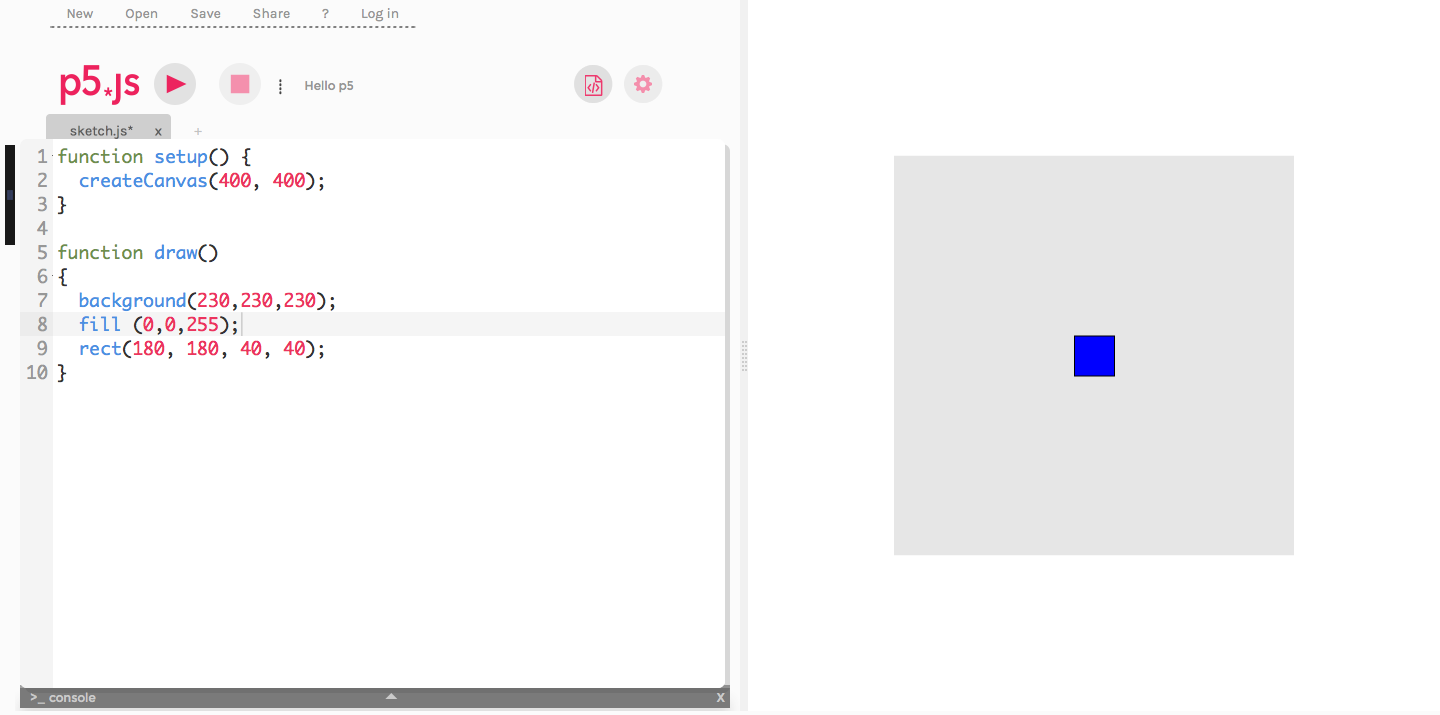
Figure 6. Placing a blue square (rect) in the center of the canvas
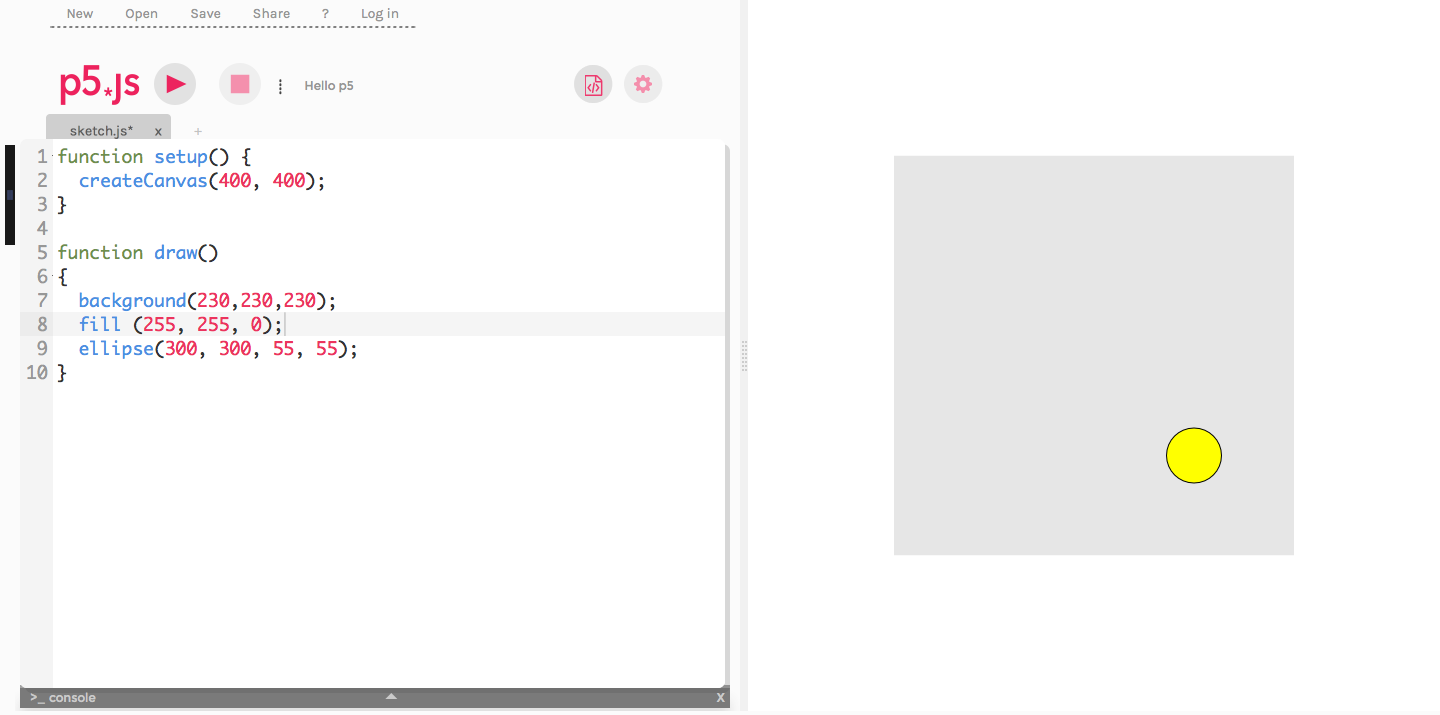
Figure 7. Painting a yellow circle (ellipse) in a corner of the canvas
In the last part of the exercise using simple geometric figures, learners can use the function fill() to experiment the colorization (figures 6 and 7).
Also they can put all the figures together in the canvas, so teacher can explain how those painted after other ones can cover the first drawn. In this case is recommended to explain this effect using the layers metaphor (the canvas has several layers, from deep to the nearest to the spectator that can be overlapped).
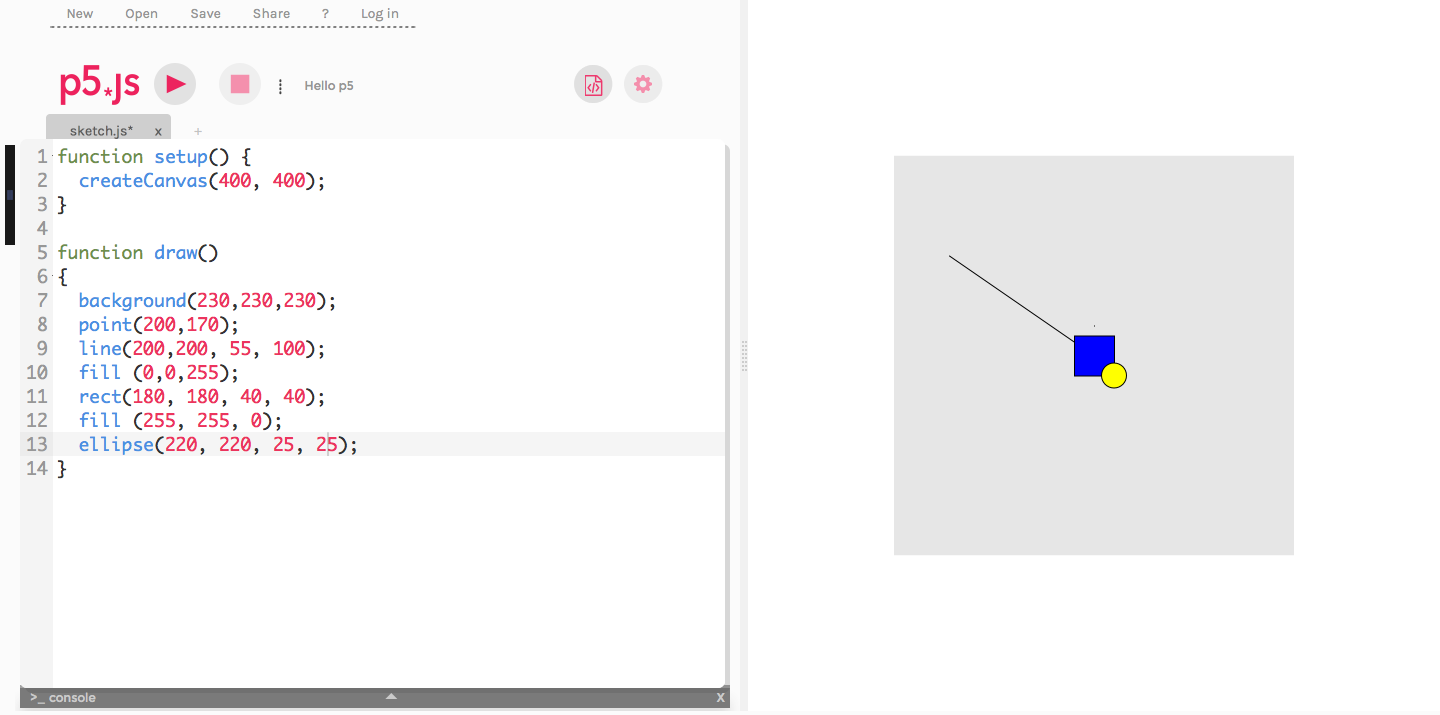
Figure 8. Painting all figures together. Teacher should explain how/why yellow ellipse covers the blue square.
3. Using loops and decision points to make generative drawings
Depending on the previous knowledge of the students, mainly if they know programming structures like for or if, teacher can explain how to replicate figures in the canvas by using loops, colorizing figures through using if decision points, etc. as can be observed in the following figures:
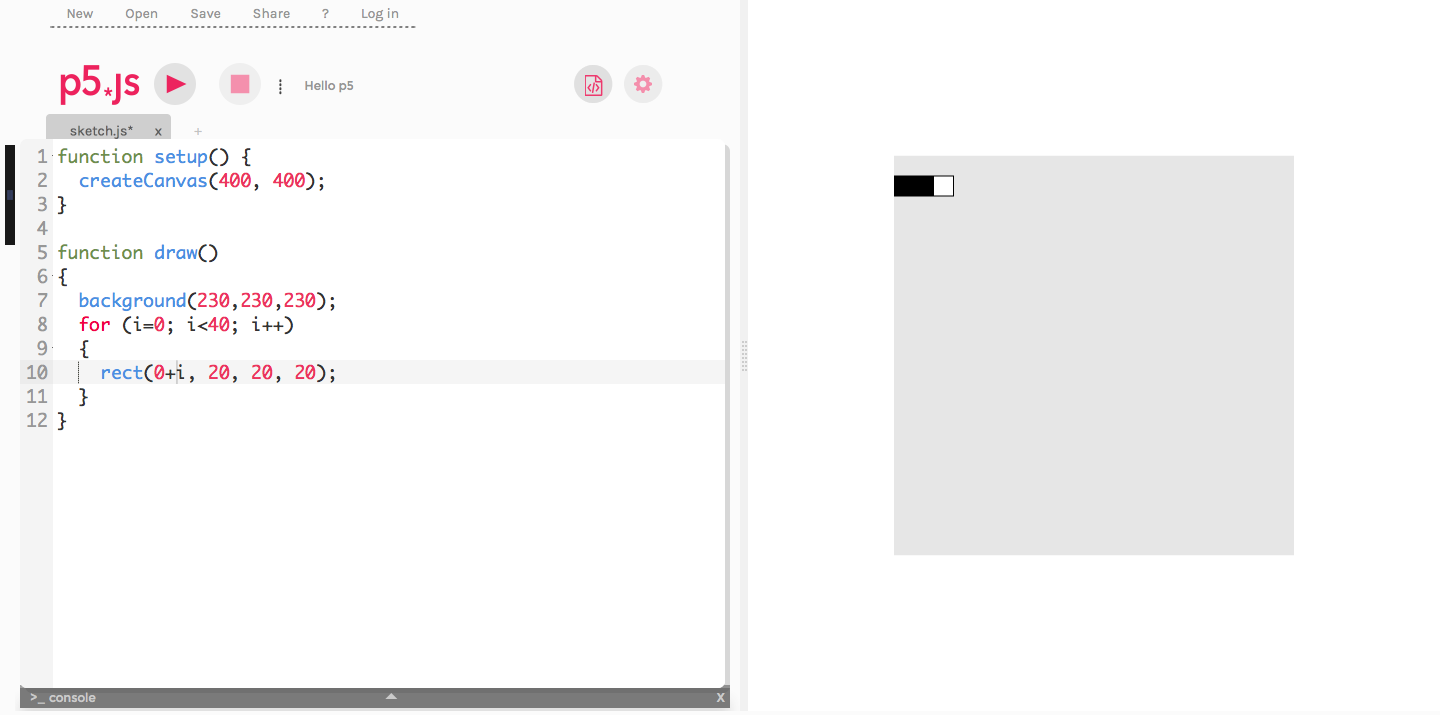
Figure 9. 40 squares (rect) are painted in the X axis using only a minimal separator (i for counter, minimal value separator of 0 to maximal separator of 39)
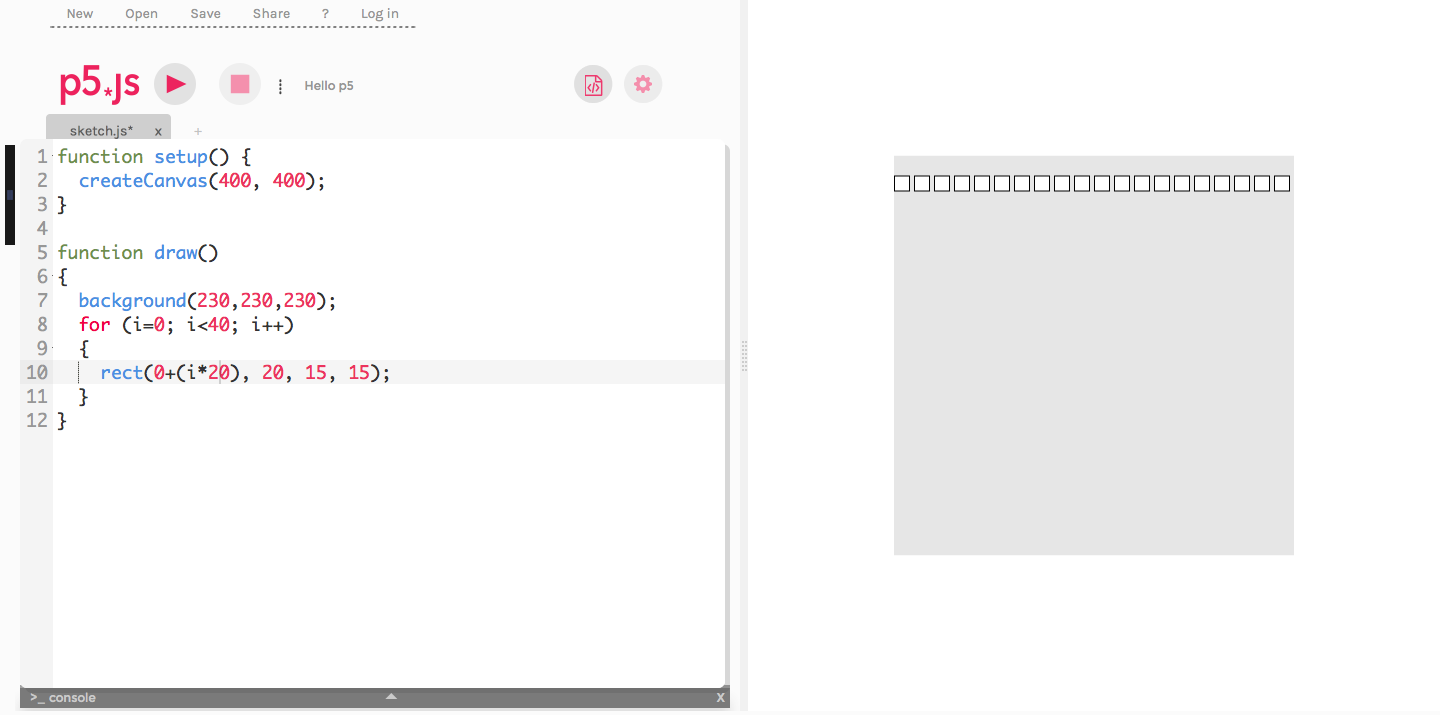
Figure 10. 40 squares (rect) are painted in the X axis using a variable as separator (i for counter multiplied by a constant -20-). This lead to paint squares separated among them by the same separation. Take note that several squares will be painted outside the canvas.
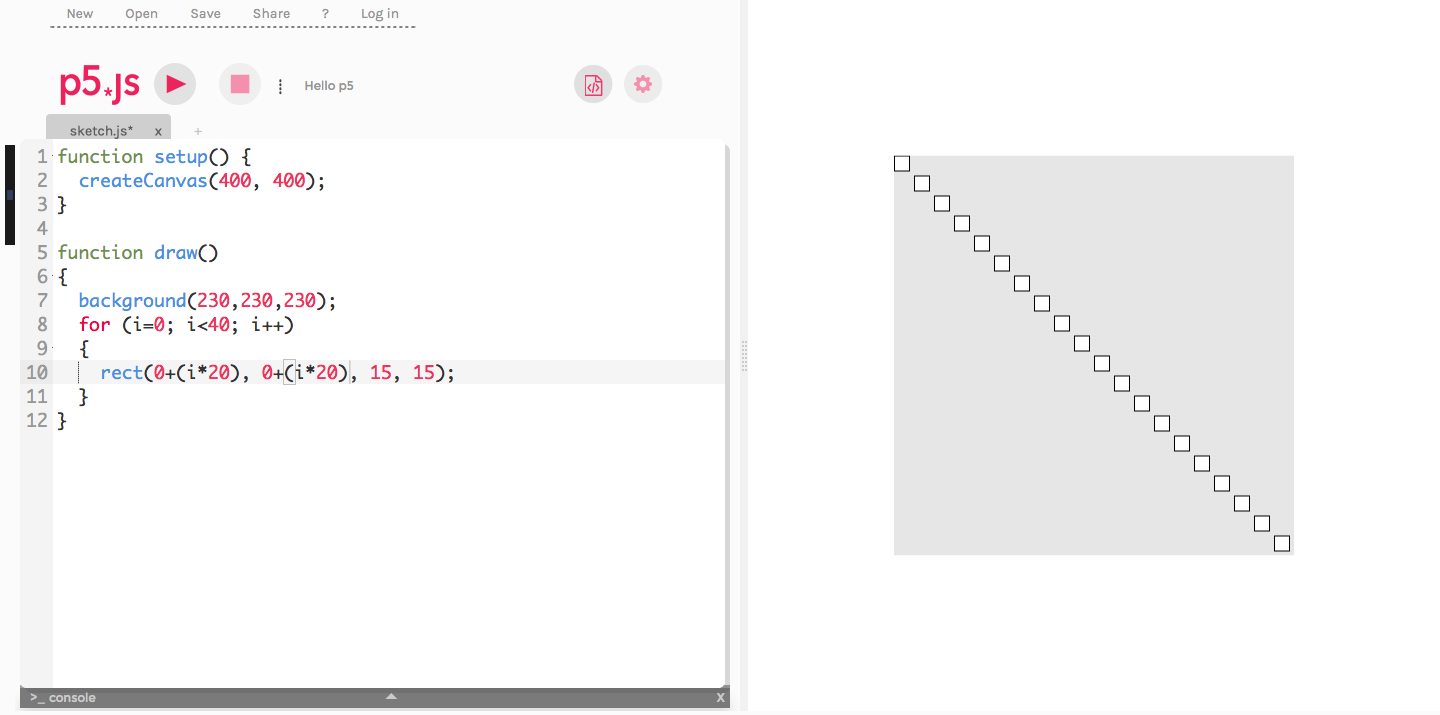
Figure 11. 40 squares (rect) are painted using X and Y axis using variable positions. Due the canvas size, all squares (40) will not be drawn
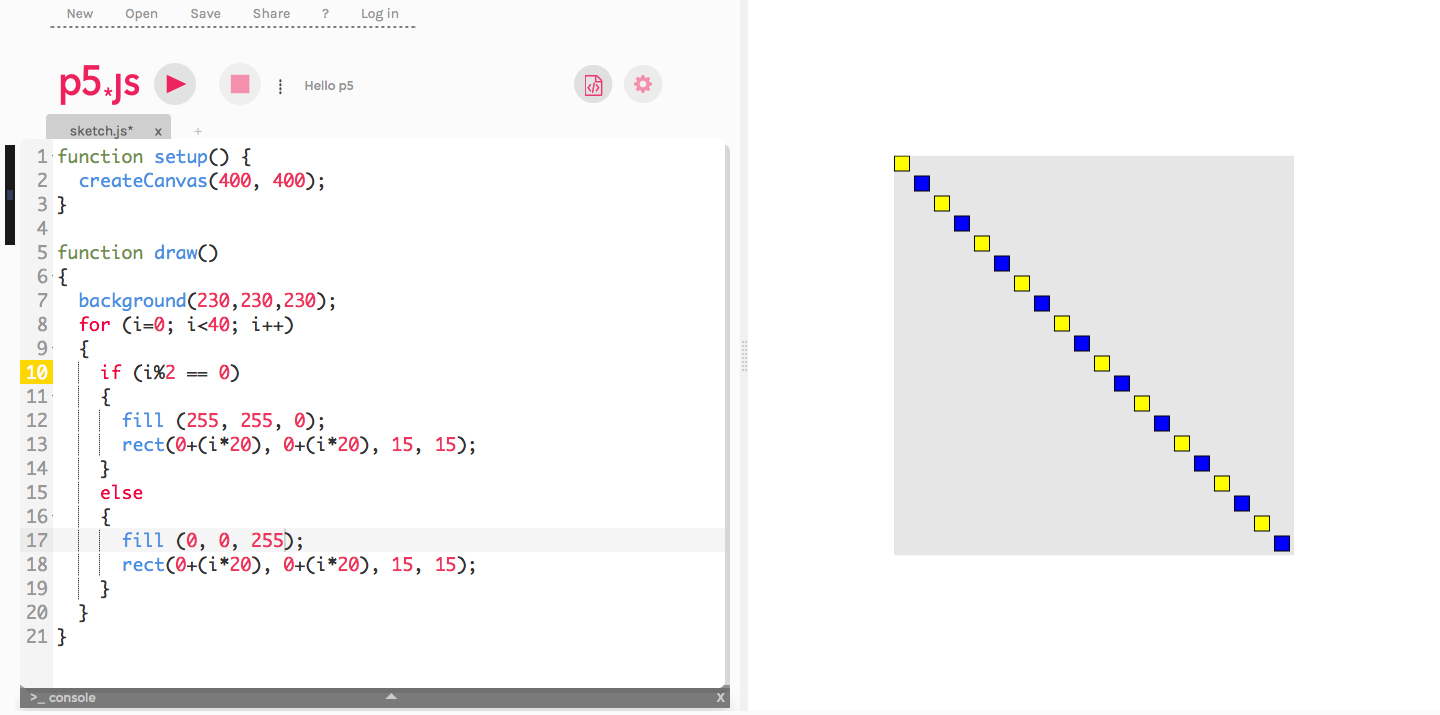
Figure 12. 40 squares (rect) are painted using X and Y axis using variable positions. In this case, the even figures are colorized in blue and odd figures in yellow color. This can help teachers to explain concepts like module, even and odd elements detection, if decision points, etc. Due the canvas size, all squares (40) will not be drawn
4. More advanced visual compositions using loops and decision points
To finalize that, and depending the students’ skills and teacher ability to explain more complicated problems and visual compositions, using the previous foundations, they can experiment with some creative geometric shapes and placements like the presented in the figures 13 and 14
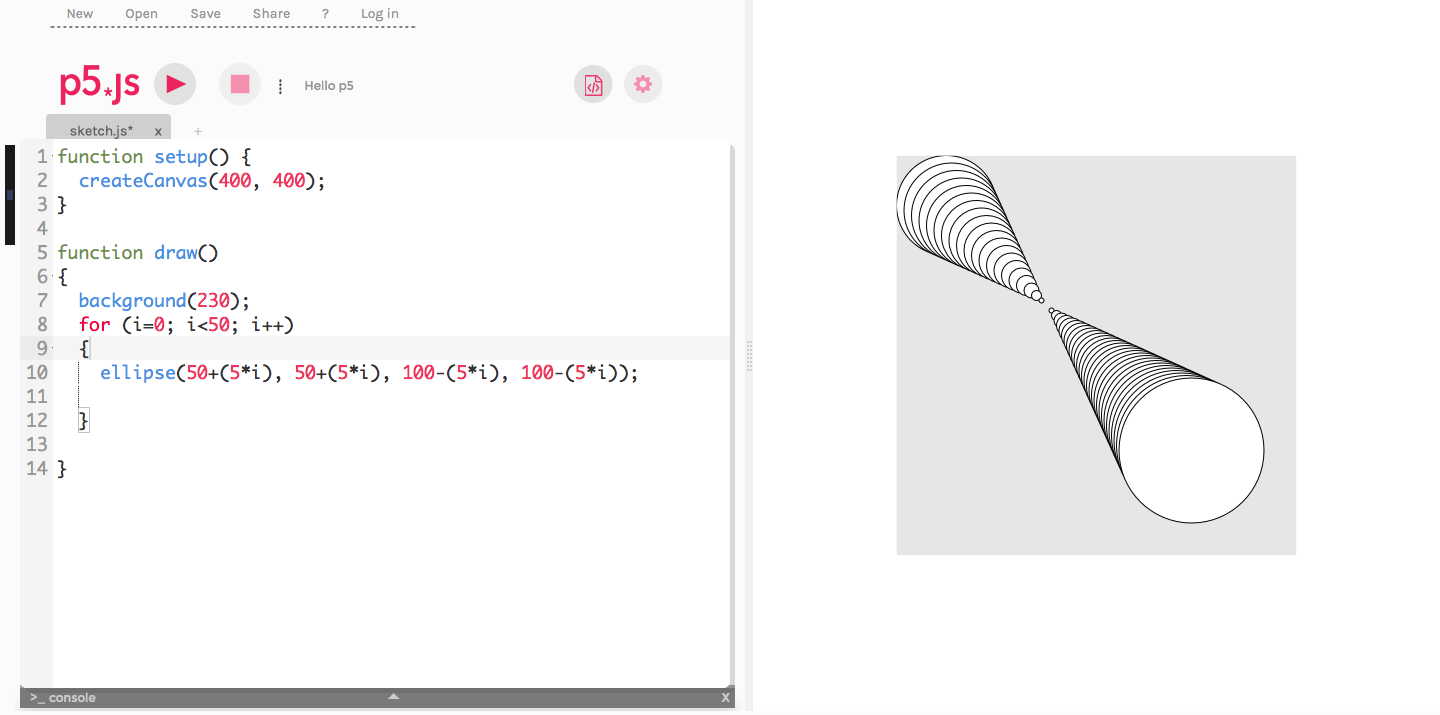
Figure 13. Generating to cones through using the counter variable inside a for
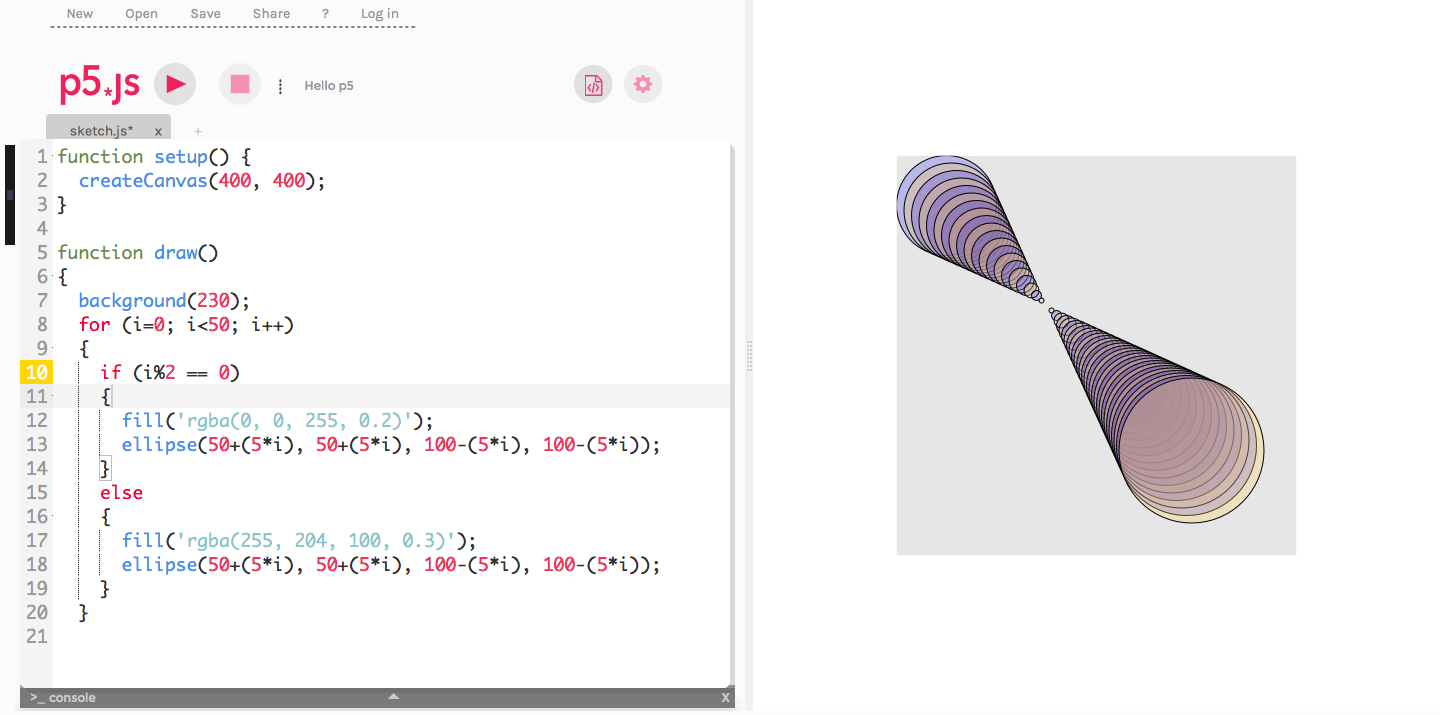
Figure 14. Using the figure created in the figure 13, teacher/students can play with colors. In this case (overlapped figures) is recommended to use colors with an alpha mask in order to create different visual experiences and expanding color learning.
