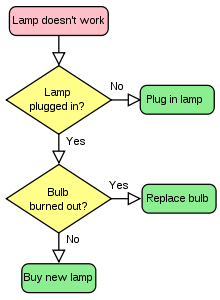
 A flowchart is one way of displaying an algorithm. One advantage of using a flow chart is that the way different operations are represented are standardised so that anyone who is familiar with the symbols can follow other people’s algorithms.
Preparation
Prepare a set of flow chart symbols (boxes and arrows) using the templates.
Introduction
Ask the class to research the meaning of the word ‘flowchart’ and then discuss their findings. The Wikipedia definition is:
“A flowchart is a type of diagram that represents an algorithm, workflow or process, showing the steps as boxes of various kinds, and their order by connecting them with arrows.”
Another way of explaining it is that a flowchart is a diagram that represents a solution to a problem.
Discuss with the class why it is a good idea to use flowcharts to represent their algorithms. (e.g clarity, ease of communication between people, shows the decisions that have to be made and the options available etc)
They are a useful way of planning how a computer program might work, and show others your thinking.
A flow chart shows the key points in an algorithm:
- the start and end
- the order in which the sequences of instructions are performed
- the points where inputs and outputs occur
- the points where decisions are made about what to do next
A sequence of many instructions that does not involve any of these key points may be represented as a single rectangular box.
Flow charts use a variety of standard flow chart symbols to represent different elements, and arrows to show the flow or direction. These shapes are formally agreed standards (British Standard BS4058). The most commonly used symbols are:
Activity 1: Identifying symbols and what they do
Use a simple algorithm the learners have already constructed (e.g making toast) and print out the individual steps. Then, in groups, set out the rectangular ‘command’ flowchart blocks in a vertical column and lay the individual lines of instruction in the algorithm over each box. Then add the arrows.
Introduce the ‘start’ / ‘stop’ blocks and add them to the algorithm.
Talk to the class about what decisions they may have to make when running their algorithm. For example, supposing they burn the toast? Are they going to ignore the fact that it is burned and just carry on? Or are they going to scrape the burned bits off? Or are they going to throw the burned toast away? Maybe it depends on how burned the toast is!
So after the command line ‘take the toast out of the toaster’, they may need a decision diamond asking ‘Is the toast burned?’ There could be two answers ‘Yes’ or ‘No’ or three answers ‘Yes’, ‘No’ and ‘A little bit’ (or ‘partially’ if they know the word). Start with two answers. Write the question (e.g is toast burned?) on a new card and lay it over the decision diamond. Add two arrows to the decision diamond (typically from the points on the left and right. Label one arrow ‘yes’ and the other ‘no’. Put another command rectangle and the end of each arrow. Let the children decide on the command they will put in each box.
Finally, whether the answer is ‘no’ or ‘yes’ (with the command ‘ throw it away’) they will need to work out at what point they rejoin their original algorithm!
Activity 2: Practising flow charts
Divide the children into groups and give each group a set of cards with the following scenarios. Ask them to draw the flow chart that represents the algorithm.
- The bus you have to take for school goes at 8.00 am. It takes you half an hour to get ready. If you get up late and miss the bus, you can take a train that leaves at 8.15 but then you have a 20 minute walk when you get to the station nearest the school and you don’t get there until after the bell goes at 9.00 am and you miss registration and have to see the secretary.
- There are two possible destinations for the school trip. If it is raining that week then the minibus is taking you to the museum and you will need to wear your school uniform and take money to buy lunch in the cafe. If the weather looks good, then the plan is to go to a farm. You will need to wear wellingtons and old clothes.
- If the Welsh football team beats Serbia and the Republic of Ireland draw or lose to Austria, then Serbia would have 11 points and Wales and Austria would have 10 points, leaving Wales with a home game against Austria, then two away games against Moldova and Georgia, before a final game against Ireland.
